Grafana Dashboards for CI/CD and Developer Productivity: DORA Metrics from GitHub Actions and Argo CD
Every engineering leader eventually asks the same question: are we getting faster, or just busier? The DORA metrics are the most widely used answer. There are commercial tools for them, but if you already run Grafana you can get 80 percent of the value with data you control and queries you can read.
This post builds a DORA dashboard from three sources: GitHub Actions for build and deploy events, Argo CD for confirming the rollout, and a small incident event for restore time. The events land in Loki as JSON lines and Grafana turns them into the four panels everyone expects, plus the pipeline-level detail you need to act on them.
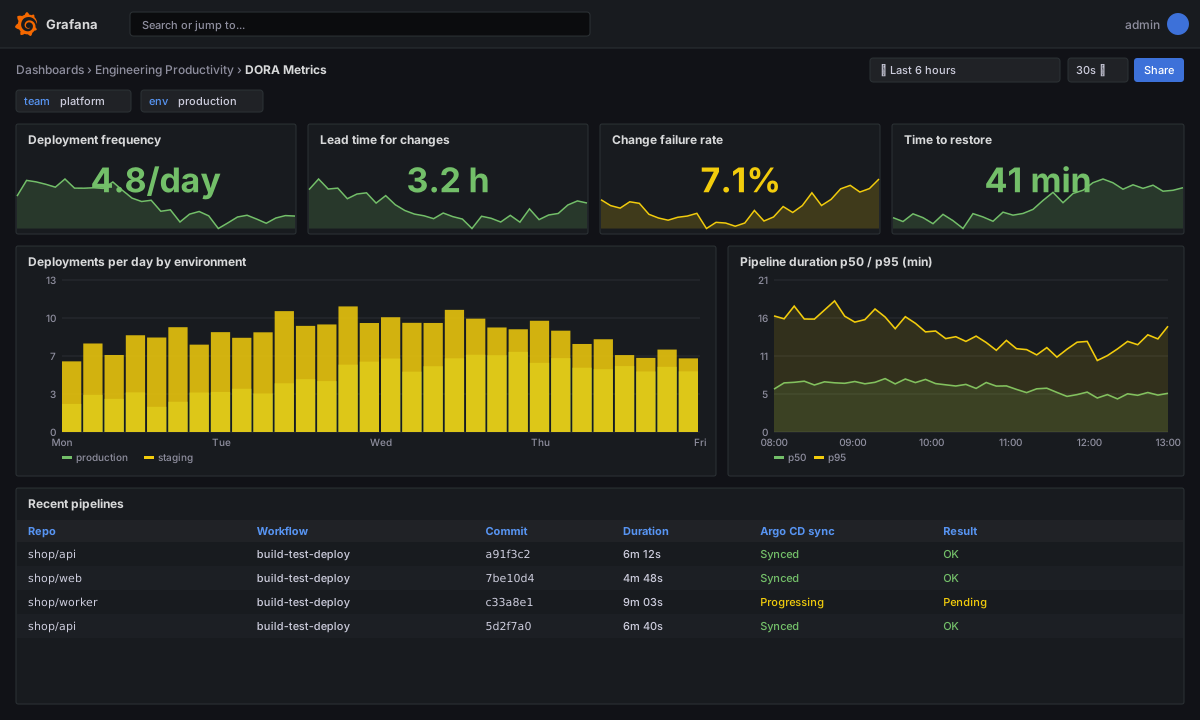
The metrics and what they actually measure
| Metric | Question it answers | Event you need |
|---|---|---|
| Deployment frequency | How often do we ship to production? | One event per successful production deploy |
| Lead time for changes | How long from commit to running in production? | Commit timestamp and deploy timestamp |
| Change failure rate | What share of deploys cause a problem? | Deploy result, rollback or hotfix flag |
| Time to restore service | How fast do we recover from a failure? | Incident opened and resolved timestamps |
The 2024 DORA report added a fifth signal, deployment rework rate, which counts unplanned deployments caused by an incident. You can approximate it from the same event stream by tagging hotfix deploys, and I will show where.
One warning before the plumbing. These numbers are team health indicators, not individual performance scores. The moment someone's bonus depends on deployment frequency, you will get a lot of tiny meaningless deploys. Put the dashboard on a team screen, discuss the trends in retros, and never rank people by it.
Why events in Loki
I considered Prometheus counters, a dedicated exporter and the GitHub data source. I chose Loki for three reasons:
- Events, not time series. A deployment is a discrete event with attributes: service, commit, author, duration. Loki stores those as structured log lines and LogQL can turn them into metrics on demand.
- No new service. If you already run Loki you add nothing to operate. An exporter that polls the GitHub API needs hosting, tokens and rate-limit handling.
- History. You can backfill from old workflow runs later by pushing events with past timestamps.
The event schema
Keep it small and stable. Everything on the dashboard derives from these fields.
{
  "event": "deployment",
  "service": "shop-api",
  "environment": "production",
  "result": "success",
  "sha": "a91f3c2",
  "author": "team-platform",
  "commit_ts": 1739262000,
  "deploy_ts": 1739273520,
  "lead_time_seconds": 11520,
  "pipeline_seconds": 372,
  "is_hotfix": false
}
Use labels sparingly. Loki indexes labels, so only put low-cardinality values there (job, environment, service). Everything else stays in the JSON body and is parsed at query time with | json.
Emitting events from GitHub Actions
Add one job at the end of your deploy workflow. It waits for Argo CD to report the application healthy, then pushes the event. Waiting matters: a deploy that has merged but not rolled out is not a deploy.
# .github/workflows/deploy.yml (final job)
  emit-dora-event:
    needs: [build, update-gitops]
    if: always() && needs.update-gitops.result != 'skipped'
    runs-on: ubuntu-latest
    steps:
      - uses: actions/checkout@v4
        with: { fetch-depth: 0 }

      - name: Wait for Argo CD rollout
        id: argo
        continue-on-error: true
        run: |
          argocd login "$ARGOCD_SERVER" --auth-token "$ARGOCD_TOKEN" --grpc-web
          argocd app wait shop-api --health --sync --timeout 600
        env:
          ARGOCD_SERVER: ${{ vars.ARGOCD_SERVER }}
          ARGOCD_TOKEN: ${{ secrets.ARGOCD_TOKEN }}

      - name: Push deployment event to Loki
        run: |
          COMMIT_TS=$(git show -s --format=%ct "$GITHUB_SHA")
          NOW=$(date +%s)
          RESULT=${{ steps.argo.outcome == 'success' && 'success' || 'failure' }}
          HOTFIX=${{ startsWith(github.head_ref, 'hotfix/') }}
          BODY=$(jq -n \
            --arg sha "${GITHUB_SHA::7}" --arg result "$RESULT" \
            --arg author "$GITHUB_ACTOR" \
            --argjson commit_ts "$COMMIT_TS" --argjson deploy_ts "$NOW" \
            --argjson hotfix "$HOTFIX" '{
              event:"deployment", service:"shop-api", environment:"production",
              result:$result, sha:$sha, author:$author,
              commit_ts:$commit_ts, deploy_ts:$deploy_ts,
              lead_time_seconds:($deploy_ts-$commit_ts), is_hotfix:$hotfix }')
          curl -sS -u "$LOKI_USER:$LOKI_TOKEN" \
            -H "Content-Type: application/json" \
            "$LOKI_URL/loki/api/v1/push" \
            -d "$(jq -n --arg line "$BODY" --arg ts "$(date +%s%N)" \
              '{streams:[{stream:{job:"dora",environment:"production",service:"shop-api"},values:[[$ts,$line]]}]}')"
        env:
          LOKI_URL: ${{ vars.LOKI_URL }}
          LOKI_USER: ${{ secrets.LOKI_USER }}
          LOKI_TOKEN: ${{ secrets.LOKI_TOKEN }}
For lead time I measure from the commit timestamp of the deployed SHA. If you squash-merge, that is the squash commit and you lose time spent in review. If review time matters to you, which it often does, use the PR's first commit timestamp from the GitHub API instead and store it as first_commit_ts. Pick one definition and write it on the dashboard, because comparing across teams only works if everyone uses the same one.
Incident events
Time to restore needs two timestamps from your incident process. The least friction path I have found is a tiny workflow that anyone can trigger when an incident opens or closes, or a webhook from your paging tool:
# .github/workflows/incident-event.yml
name: incident-event
on:
  workflow_dispatch:
    inputs:
      id:     { description: "Incident id", required: true }
      state:  { description: "opened | resolved", required: true, type: choice, options: [opened, resolved] }
      service: { description: "Service", required: true }
jobs:
  push:
    runs-on: ubuntu-latest
    steps:
      - name: Push incident event
        run: |
          LINE=$(jq -nc --arg id "${{ inputs.id }}" --arg st "${{ inputs.state }}" \
            '{event:"incident", incident_id:$id, state:$st}')
          curl -sS -u "$LOKI_USER:$LOKI_TOKEN" -H "Content-Type: application/json" \
            "$LOKI_URL/loki/api/v1/push" \
            -d "$(jq -n --arg line "$LINE" --arg ts "$(date +%s%N)" --arg svc "${{ inputs.service }}" \
              '{streams:[{stream:{job:"dora",service:$svc},values:[[$ts,$line]]}]}')"
        env:
          LOKI_URL: ${{ vars.LOKI_URL }}
          LOKI_USER: ${{ secrets.LOKI_USER }}
          LOKI_TOKEN: ${{ secrets.LOKI_TOKEN }}
The LogQL behind each panel
| Panel | Visualization | LogQL |
|---|---|---|
| Deployment frequency | Stat, per day | sum(count_over_time({job="dora", environment="production"} | json | event="deployment" | result="success" [24h])) |
| Deployments per day | Bar chart | sum by (service) (count_over_time({job="dora", environment="production"} | json | event="deployment" | result="success" [1d])) |
| Lead time (median) | Stat | quantile_over_time(0.5, {job="dora", environment="production"} | json | event="deployment" | result="success" | unwrap lead_time_seconds [7d]) |
| Change failure rate | Stat, percent | see below |
| Rework rate | Stat, percent | hotfix deploys divided by all deploys |
| Pipeline duration p95 | Time series | quantile_over_time(0.95, {job="dora"} | json | event="deployment" | unwrap pipeline_seconds [1d]) |
Change failure rate is a ratio of two counts. Failed deploys plus hotfixes over all deploys:
(
  sum(count_over_time({job="dora", environment="production"} | json | event="deployment" | result="failure" [7d]))
  +
  sum(count_over_time({job="dora", environment="production"} | json | event="deployment" | is_hotfix="true" [7d]))
)
/
sum(count_over_time({job="dora", environment="production"} | json | event="deployment" [7d]))
The parentheses around the numerator matter. Without them, division binds tighter than addition and you get a wrong answer with no error.
Time to restore is the awkward one because it needs pairs of events. The practical approach is to compute it when the incident closes and write the duration into the resolved event, then query it like lead time:
quantile_over_time(0.5, {job="dora"} | json | event="incident" | state="resolved" | unwrap duration_seconds [30d])Your incident workflow can compute duration_seconds by reading the opened event's timestamp from your tracker. Keep that logic in one place rather than in the dashboard.
Making the dashboard useful and not just pretty
A DORA board that nobody acts on is decoration. A few design choices that help:
- Use 7-day and 30-day windows, not 24 hours. Daily values are noise for most teams. Show the 7-day stat and a 30-day trend line.
- Break down by service and by team with dashboard variables. Averages across a whole company hide the one service that is a problem:
Variable: service
Query:    label_values({job="dora"}, service)
Include All: true
- Show the slowest pipelines. A table of recent runs with duration and result sends people directly to the thing they can fix. If your p95 pipeline time is 14 minutes, that is a conversation about caching and test parallelism.
- Annotate deployments on other dashboards. Add an annotation query so every latency or error graph shows vertical lines at deploys:
{job="dora", environment="production"} | json | event="deployment"Set the annotation text to {{service}} {{sha}} and you can see at a glance whether a regression started with a release.
Alerts that matter
Alert on trends that signal a process problem, not on every failed pipeline:
groups:
  - name: dora
    rules:
      - alert: ChangeFailureRateHigh
        expr: |
          (
            sum(count_over_time({job="dora"} | json | event="deployment" | result="failure" [7d]))
            /
            sum(count_over_time({job="dora"} | json | event="deployment" [7d]))
          ) > 0.15
        for: 1h
        labels: { severity: ticket }
        annotations:
          summary: "More than 15% of production deploys failed in the last 7 days"
Route it to a team channel, not a pager. It is a prompt to look at the process, not an outage.
Pitfalls I would warn you about
| Pitfall | Why it hurts | Fix |
|---|---|---|
| Counting merges as deploys | Overstates frequency, ignores rollout failures | Emit after Argo CD reports healthy |
Putting sha or author in labels | High cardinality, slow queries, Loki limits | Keep them in the JSON body |
| Mixing definitions across teams | Numbers cannot be compared | Document definitions on the dashboard |
| Ranking individuals | Gaming and distrust | Team-level views only |
| Ignoring failed pipelines | Hides flaky tests and capacity issues | Track failed and cancelled runs as a separate panel |
Wrap-up
You do not need a separate product to start measuring delivery. One event schema, one final workflow job, and a handful of LogQL queries give you deployment frequency, lead time, failure rate and restore time in the Grafana you already run. Start with the definitions, write them down, and watch the trend lines for a month before deciding what to improve first.