Grafana Observability for Docker Compose Stacks: Prometheus, Loki and Tempo from Day One
Most teams add observability after the first production incident. By then the app has forty endpoints, nobody remembers which ones matter, and the dashboards get built under pressure. There is a cheaper way: run the same observability stack on your laptop, in the same docker-compose.yml as the app, from the first commit.
This post builds that stack with Grafana 10.2, Prometheus, Loki and Tempo. By the end you will have one dashboard where you can see a latency spike, click a data point to open the trace that caused it, and from the trace jump to the exact log lines. Everything runs with docker compose up.
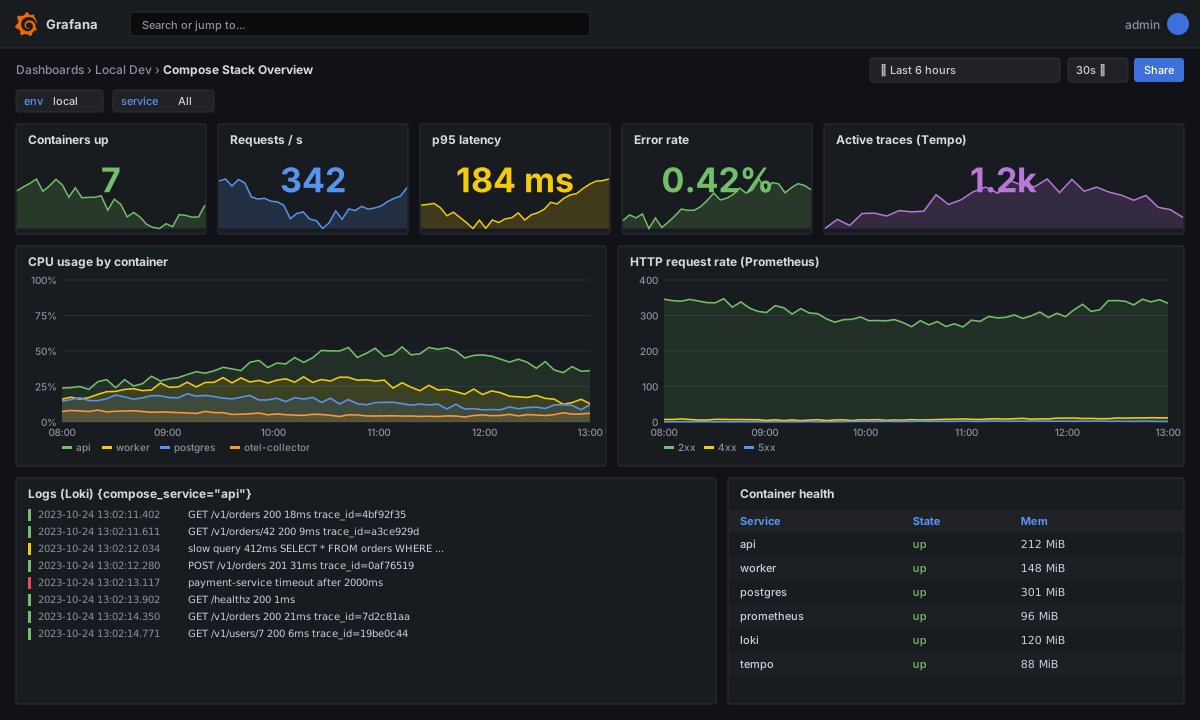
Why run observability in Compose
Local observability sounds like overkill until you try it. Three things change:
- Instrumentation gets reviewed like code. If a new endpoint has no span or metric, you notice it in the PR, not in production.
- Dashboards are versioned. Grafana supports file provisioning, so datasources and dashboards live in git next to the service.
- Production parity. The same OpenTelemetry SDK settings, the same label names, the same PromQL. You are not learning a different tool when something breaks at 2am.
The cost is memory. The full stack below idles around 600 to 800 MiB, which is fine on a developer machine and easy to turn off with a Compose profile.
Architecture
The app sends traces to an OpenTelemetry Collector over OTLP. The collector forwards traces to Tempo and exposes span-derived metrics to Prometheus. Container logs reach Loki through Promtail's Docker service discovery. Grafana reads from all three.
The Compose file
Here is the full stack. Pin image tags. latest on an observability tool is how a Tuesday upgrade turns into a broken dashboard.
# docker-compose.yml
services:
  api:
    build: ./api
    ports: ["8080:8080"]
    environment:
      OTEL_SERVICE_NAME: shop-api
      OTEL_EXPORTER_OTLP_ENDPOINT: http://otel-collector:4317
      OTEL_EXPORTER_OTLP_PROTOCOL: grpc
      OTEL_METRICS_EXPORTER: none
    labels:
      logging: "promtail"
    depends_on: [otel-collector]

  otel-collector:
    image: otel/opentelemetry-collector-contrib:0.88.0
    command: ["--config=/etc/otel/config.yaml"]
    volumes: ["./otel/config.yaml:/etc/otel/config.yaml:ro"]
    ports: ["4317:4317", "8889:8889"]

  prometheus:
    image: prom/prometheus:v2.47.2
    command:
      - --config.file=/etc/prometheus/prometheus.yml
      - --enable-feature=exemplar-storage
    volumes: ["./prometheus/prometheus.yml:/etc/prometheus/prometheus.yml:ro"]
    ports: ["9090:9090"]

  loki:
    image: grafana/loki:2.9.1
    command: -config.file=/etc/loki/local-config.yaml
    ports: ["3100:3100"]

  promtail:
    image: grafana/promtail:2.9.1
    command: -config.file=/etc/promtail/config.yml
    volumes:
      - ./promtail/config.yml:/etc/promtail/config.yml:ro
      - /var/run/docker.sock:/var/run/docker.sock:ro

  tempo:
    image: grafana/tempo:2.2.3
    command: ["-config.file=/etc/tempo.yaml"]
    volumes: ["./tempo/tempo.yaml:/etc/tempo.yaml:ro"]

  cadvisor:
    image: gcr.io/cadvisor/cadvisor:v0.47.2
    volumes:
      - /:/rootfs:ro
      - /var/run:/var/run:ro
      - /sys:/sys:ro
      - /var/lib/docker/:/var/lib/docker:ro

  grafana:
    image: grafana/grafana:10.2.0
    ports: ["3000:3000"]
    environment:
      GF_AUTH_ANONYMOUS_ENABLED: "true"
      GF_AUTH_ANONYMOUS_ORG_ROLE: Admin
    volumes:
      - ./grafana/provisioning:/etc/grafana/provisioning:ro
      - ./grafana/dashboards:/var/lib/grafana/dashboards:ro
Anonymous admin is fine for a laptop. Remove those two variables before you copy this anywhere shared.
Collector configuration
The collector receives OTLP, batches, and fans out. The spanmetrics connector turns spans into RED metrics (rate, errors, duration) so you get service-level dashboards for free.
# otel/config.yaml
receivers:
  otlp:
    protocols:
      grpc:
        endpoint: 0.0.0.0:4317

processors:
  batch: {}

connectors:
  spanmetrics:
    histogram:
      explicit:
        buckets: [10ms, 50ms, 100ms, 250ms, 500ms, 1s, 2s]
    dimensions:
      - name: http.method
      - name: http.route

exporters:
  otlp/tempo:
    endpoint: tempo:4317
    tls:
      insecure: true
  prometheus:
    endpoint: 0.0.0.0:8889
    enable_open_metrics: true

service:
  pipelines:
    traces:
      receivers: [otlp]
      processors: [batch]
      exporters: [otlp/tempo, spanmetrics]
    metrics:
      receivers: [spanmetrics]
      exporters: [prometheus]
Prometheus, Promtail and Tempo
# prometheus/prometheus.yml
global:
  scrape_interval: 15s
scrape_configs:
  - job_name: otel-collector
    static_configs: [{ targets: ["otel-collector:8889"] }]
  - job_name: cadvisor
    static_configs: [{ targets: ["cadvisor:8080"] }]
  - job_name: api
static_configs: [{ targets: ["api:8080"] }]# promtail/config.yml
server: { http_listen_port: 9080 }
positions: { filename: /tmp/positions.yaml }
clients:
- url: http://loki:3100/loki/api/v1/push
scrape_configs:
- job_name: docker
docker_sd_configs:
- host: unix:///var/run/docker.sock
refresh_interval: 5s
filters:
- name: label
values: ["logging=promtail"]
relabel_configs:
- source_labels: [__meta_docker_container_label_com_docker_compose_service]
target_label: compose_service
- source_labels: [__meta_docker_container_name]
regex: "/(.*)"
target_label: container# tempo/tempo.yaml
server:
http_listen_port: 3200
distributor:
receivers:
otlp:
protocols:
grpc:
storage:
trace:
backend: local
wal: { path: /tmp/tempo/wal }
local: { path: /tmp/tempo/blocks }Connecting the three signals
Separate tools are not observability. The value comes from pivoting. Grafana datasource provisioning sets up the three links you will use most:
# grafana/provisioning/datasources/datasources.yml
apiVersion: 1
datasources:
  - name: Prometheus
    type: prometheus
    uid: prometheus
    url: http://prometheus:9090
    jsonData:
      exemplarTraceIdDestinations:
        - name: trace_id
          datasourceUid: tempo
  - name: Loki
    type: loki
    uid: loki
    url: http://loki:3100
    jsonData:
      derivedFields:
        - name: trace_id
          matcherRegex: 'trace_id=(\w+)'
          url: '$${__value.raw}'
          datasourceUid: tempo
  - name: Tempo
    type: tempo
    uid: tempo
    url: http://tempo:3200
    jsonData:
      tracesToLogsV2:
        datasourceUid: loki
        filterByTraceID: true
      serviceMap:
datasourceUid: prometheus| Pivot | How it works | Where you use it |
|---|---|---|
| Metric to trace | Exemplars attach a trace ID to a histogram sample | Click a dot on a latency panel |
| Log to trace | derivedFields regex pulls trace_id out of the log line | Explore, Loki query results |
| Trace to logs | tracesToLogsV2 queries Loki by trace ID and time range | Trace view, Logs button |
| Trace to metrics | Service graph reads span metrics from Prometheus | Tempo service map |
For the log-to-trace link to work, your app must write the trace ID into the log line. With the OpenTelemetry Python logging instrumentation that is one setting:
# api/app.py
import logging
from opentelemetry.instrumentation.logging import LoggingInstrumentor

LoggingInstrumentor().instrument(
    set_logging_format=True,
    log_level=logging.INFO,
)
# log lines now look like:
# 2023-10-24 13:02:11 INFO [app] [trace_id=4bf92f3577b34da6a3ce929d0e0e4736 span_id=00f067aa0ba902b7] GET /v1/orders 200
Start the app with auto-instrumentation so you do not hand-write spans for every framework call:
# api/Dockerfile
FROM python:3.12-slim
WORKDIR /app
COPY requirements.txt .
RUN pip install --no-cache-dir -r requirements.txt \
 && opentelemetry-bootstrap -a install
COPY . .
CMD ["opentelemetry-instrument", "uvicorn", "app:app", "--host", "0.0.0.0", "--port", "8080"]
The queries behind the dashboard
You do not need many. These five cover most "is it healthy" questions for a Compose app:
| Panel | Query |
|---|---|
| Request rate | sum(rate(calls_total{service_name="shop-api"}[1m])) by (http_route) |
| Error rate | sum(rate(calls_total{status_code="STATUS_CODE_ERROR"}[5m])) / sum(rate(calls_total[5m])) |
| p95 latency | histogram_quantile(0.95, sum(rate(duration_milliseconds_bucket{service_name="shop-api"}[5m])) by (le, http_route)) |
| Container CPU | sum(rate(container_cpu_usage_seconds_total{name=~".+"}[1m])) by (name) |
| Container memory | container_memory_working_set_bytes{name=~".+"} |
For logs, start with {compose_service="api"} |= "error". When you want a rate for a panel, wrap it: sum(rate({compose_service="api"} |= "error" [1m])).
Keeping it cheap
A few settings keep the stack from eating your laptop:
- Set
scrape_interval: 15sor higher locally. Five seconds feels useful and costs a lot of storage churn. - Put the stack behind a Compose profile so
docker compose upstays fast when you do not need it:
  prometheus:
    profiles: ["observability"]
Then run docker compose --profile observability up.
- Set a retention limit on Prometheus with
--storage.tsdb.retention.time=2d. - Do not sample traces locally. Keep 100 percent in dev and decide on sampling when you reach production.
What to carry into production
The Compose setup is a rehearsal, not the final design. These are the pieces that survive the move to Kubernetes or a managed service:
| Local | Production equivalent |
|---|---|
| OTLP to collector | Same, collector as a DaemonSet or gateway Deployment |
| Prometheus scrape | Prometheus Operator, or remote write to Grafana Cloud or Mimir |
| Promtail Docker discovery | Promtail or an agent with Kubernetes discovery |
| Tempo local storage | Tempo with S3, GCS or Azure Blob storage |
| Provisioned dashboards | Same JSON, deployed through your GitOps pipeline |
The label names and metric names stay the same, which is the point. Your dashboards and alerts keep working when the infrastructure underneath changes.
Wrap-up
The whole stack is about 120 lines of YAML. Once it is in the repo, new engineers get dashboards by running one command, and instrumentation gaps show up during development instead of during an outage. Start with the three links in the datasource file, because those are what make separate tools feel like one system.