Grafana Observability and Security for LLM Agents: OpenTelemetry on AWS Bedrock, GCP Vertex AI and Microsoft Foundry
An agent is a loop. It plans, calls a model, calls a tool, reads the result, calls the model again, and stops when it decides it is done or runs out of budget. When that loop misbehaves in production, the symptom is usually vague: it was slow, it cost too much, it said something it should not have. HTTP status codes tell you almost nothing about any of that.
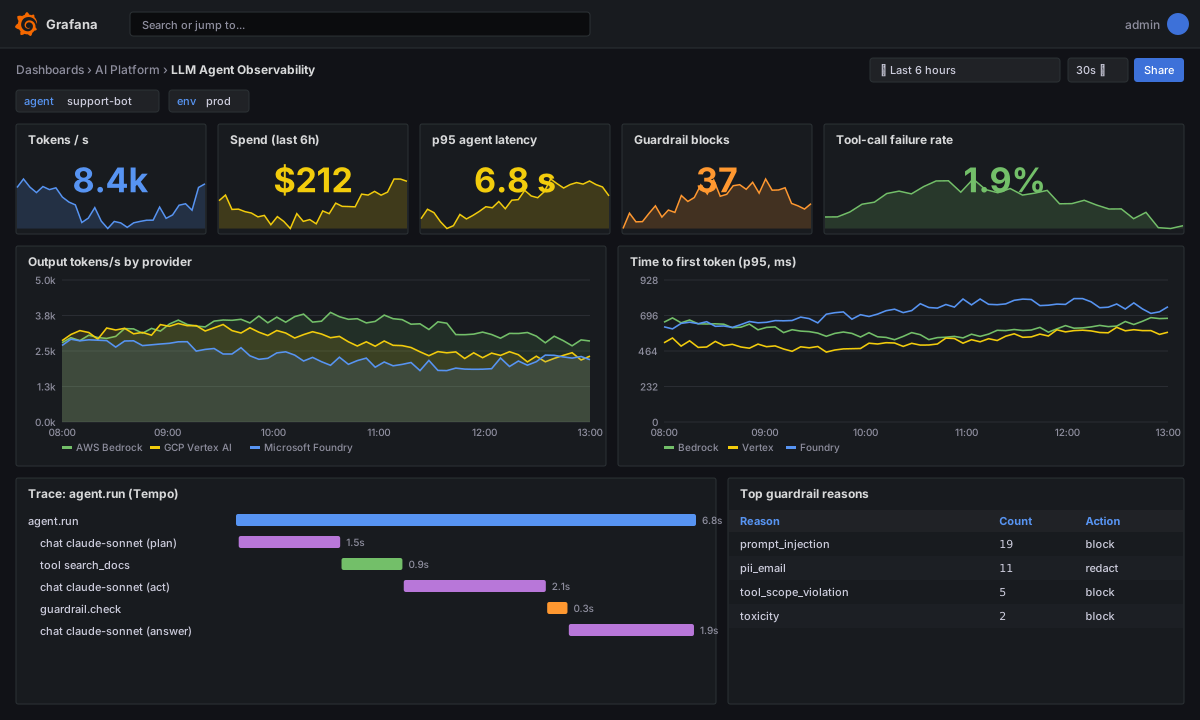
This post sets up observability for agents that use more than one model provider. The approach is the same on AWS Bedrock, GCP Vertex AI and Microsoft Foundry (formerly Azure AI Foundry): wrap each model and tool call in an OpenTelemetry span that follows the GenAI semantic conventions, export traces and metrics to Grafana, and build panels for the things that actually go wrong. Security is part of the design from the start, because the data you are tempted to log is exactly the data you should be careful with.
What to measure
Model calls are different from normal service calls in four ways. They are slow and variable, they cost money per token, they can be blocked by safety filters, and their inputs and outputs are sensitive. That gives you a short list of signals:
| Signal | Why it matters | Source |
|---|---|---|
| Input and output tokens | Cost and context-window pressure | Model response usage block |
| Time to first token | What users feel on streaming responses | Client timing |
| Operation duration | Whole-call latency, retry detection | Span duration |
| Tool call success and duration | Agents fail in tools more than in models | Tool spans |
| Guardrail interventions | Safety posture and false positives | Provider guardrail response |
| Loop iterations per task | Runaway agents, cost blow-ups | Count of model spans per run |
| Errors by type | Throttling, timeouts, content filters | Span status and error attributes |
The conventions to follow
OpenTelemetry has a set of GenAI semantic conventions. They were still marked as development status when I wrote this, so expect attribute names to shift between releases and pin your instrumentation library version. The names I use below are the stable-looking core:
| Attribute | Example | Notes |
|---|---|---|
gen_ai.operation.name | chat | Operation type |
gen_ai.provider.name | aws.bedrock, gcp.vertex_ai, azure.ai.inference | Older releases used gen_ai.system |
gen_ai.request.model | claude-sonnet, gemini-2.5-flash | What you asked for |
gen_ai.response.model | model id returned | What actually served it |
gen_ai.usage.input_tokens | 812 | Integer |
gen_ai.usage.output_tokens | 204 | Integer |
gen_ai.response.finish_reasons | ["end_turn"] | Array of strings |
Standard metrics from the same conventions: gen_ai.client.token.usage (histogram, split by token type) and gen_ai.client.operation.duration (histogram in seconds). Content capture, meaning the prompt and completion text, is opt-in by design. Keep it off by default and read the security section before turning it on.
Architecture
Instrumenting the model call
One wrapper handles all three providers. The provider-specific code only extracts tokens and finish reasons from its own response shape.
# llm_tracing.py
import time
from contextlib import contextmanager
from opentelemetry import trace, metrics

tracer = trace.get_tracer("agent.llm")
meter = metrics.get_meter("agent.llm")

token_usage = meter.create_histogram(
    "gen_ai.client.token.usage", unit="{token}",
    description="Input and output tokens per call")
op_duration = meter.create_histogram(
    "gen_ai.client.operation.duration", unit="s",
    description="End to end model call duration")
guardrail_hits = meter.create_counter(
    "agent.guardrail.interventions", description="Guardrail blocks and redactions")

@contextmanager
def llm_span(provider: str, model: str, operation: str = "chat"):
    start = time.monotonic()
    attrs = {"gen_ai.operation.name": operation,
             "gen_ai.provider.name": provider,
             "gen_ai.request.model": model}
    with tracer.start_as_current_span(f"{operation} {model}", attributes=attrs) as span:
        try:
            yield span
        except Exception as exc:
            span.record_exception(exc)
            span.set_status(trace.StatusCode.ERROR, type(exc).__name__)
            span.set_attribute("error.type", type(exc).__name__)
            raise
        finally:
            op_duration.record(time.monotonic() - start, attrs)

def record_usage(span, provider, model, input_tokens, output_tokens, finish):
    span.set_attribute("gen_ai.usage.input_tokens", input_tokens)
    span.set_attribute("gen_ai.usage.output_tokens", output_tokens)
    span.set_attribute("gen_ai.response.finish_reasons", [finish])
    base = {"gen_ai.provider.name": provider, "gen_ai.request.model": model}
    token_usage.record(input_tokens, {**base, "gen_ai.token.type": "input"})
    token_usage.record(output_tokens, {**base, "gen_ai.token.type": "output"})
AWS Bedrock
import boto3
from llm_tracing import llm_span, record_usage, guardrail_hits

bedrock = boto3.client("bedrock-runtime", region_name="us-east-1")

def call_bedrock(model_id: str, messages: list, guardrail_id: str | None = None):
    with llm_span("aws.bedrock", model_id) as span:
        kwargs = dict(modelId=model_id, messages=messages,
                      inferenceConfig={"maxTokens": 1024, "temperature": 0.2})
        if guardrail_id:
            kwargs["guardrailConfig"] = {"guardrailIdentifier": guardrail_id,
                                         "guardrailVersion": "DRAFT", "trace": "enabled"}
        resp = bedrock.converse(**kwargs)
        usage = resp["usage"]
        record_usage(span, "aws.bedrock", model_id,
                     usage["inputTokens"], usage["outputTokens"], resp["stopReason"])
        if resp["stopReason"] == "guardrail_intervened":
            guardrail_hits.add(1, {"provider": "aws.bedrock", "action": "block"})
        return resp
GCP Vertex AI
from google import genai
from llm_tracing import llm_span, record_usage

client = genai.Client(vertexai=True, project="my-project", location="us-central1")

def call_vertex(model: str, prompt: str):
    with llm_span("gcp.vertex_ai", model) as span:
        resp = client.models.generate_content(model=model, contents=prompt)
        u = resp.usage_metadata
        finish = resp.candidates[0].finish_reason.name if resp.candidates else "none"
        record_usage(span, "gcp.vertex_ai", model,
                     u.prompt_token_count, u.candidates_token_count, finish)
        return resp
Microsoft Foundry
import os
from azure.ai.inference import ChatCompletionsClient
from azure.core.credentials import AzureKeyCredential
from llm_tracing import llm_span, record_usage

foundry = ChatCompletionsClient(
    endpoint=os.environ["FOUNDRY_ENDPOINT"],
    credential=AzureKeyCredential(os.environ["FOUNDRY_KEY"]))

def call_foundry(model: str, messages: list):
    with llm_span("azure.ai.inference", model) as span:
        resp = foundry.complete(model=model, messages=messages)
        record_usage(span, "azure.ai.inference", model,
                     resp.usage.prompt_tokens, resp.usage.completion_tokens,
                     resp.choices[0].finish_reason)
        return resp
For production on Azure I would replace the key with DefaultAzureCredential so there is no secret to leak. The same applies to Vertex (workload identity) and Bedrock (IAM role), which already work that way.
Tool calls and the agent run
Tool spans are where agents most often fail, so give them equal treatment. One parent span per task makes the whole loop a single trace.
from opentelemetry import trace
tracer = trace.get_tracer("agent.loop")

def run_agent(task: str, max_steps: int = 8):
    with tracer.start_as_current_span("agent.run", attributes={"agent.name": "support-bot"}) as run:
        for step in range(max_steps):
            reply = call_model(task)                    # llm_span inside
            run.set_attribute("agent.steps", step + 1)
            if not reply.tool_calls:
                return reply.text
            for call in reply.tool_calls:
                with tracer.start_as_current_span(f"tool {call.name}",
                        attributes={"gen_ai.operation.name": "execute_tool",
                                    "gen_ai.tool.name": call.name}) as tspan:
                    try:
                        task = invoke_tool(call)
                    except Exception as exc:
                        tspan.record_exception(exc)
                        tspan.set_status(trace.StatusCode.ERROR)
                        task = f"tool error: {exc}"
        run.set_attribute("agent.stopped_reason", "max_steps")
        return "I could not finish this task."
The max_steps cap is an observability and cost control at the same time. When agent.stopped_reason="max_steps" shows up in traces, you have found a runaway loop.
The collector: redaction and routing
Do the sensitive work at the collector, not in every service. That gives you one place to audit.
# otel-collector.yaml
receivers:
  otlp:
    protocols: { grpc: { endpoint: 0.0.0.0:4317 } }

processors:
  memory_limiter: { check_interval: 1s, limit_mib: 512 }
  # Drop content attributes even if a developer turns capture on by mistake
  attributes/strip_content:
    actions:
      - { key: gen_ai.prompt,        action: delete }
      - { key: gen_ai.completion,    action: delete }
      - { key: gen_ai.input.messages,  action: delete }
      - { key: gen_ai.output.messages, action: delete }
  # Hash user identifiers instead of storing them
  attributes/hash_user:
    actions:
      - { key: enduser.id, action: hash }
  batch: {}

exporters:
  otlphttp/grafana:
    endpoint: https://otlp-gateway-prod-us-east-0.grafana.net/otlp
    headers: { Authorization: "Basic ${env:GRAFANA_OTLP_TOKEN}" }

service:
  pipelines:
    traces:
      receivers: [otlp]
      processors: [memory_limiter, attributes/strip_content, attributes/hash_user, batch]
      exporters: [otlphttp/grafana]
    metrics:
      receivers: [otlp]
      processors: [memory_limiter, batch]
      exporters: [otlphttp/grafana]
Swap the exporter for your own Tempo and Mimir endpoints if you self-host. The processors are the same.
Panels and queries
Metric names depend on how you ingest OTLP, so check the exact names in Grafana Explore before you copy anything. With OTLP into Mimir or Grafana Cloud, the histograms above become gen_ai_client_token_usage_* and gen_ai_client_operation_duration_seconds_*. These are the queries I start from:
| Panel | Query |
|---|---|
| Output tokens/s by provider | sum by (gen_ai_provider_name) (rate(gen_ai_client_token_usage_sum{gen_ai_token_type="output"}[5m])) |
| Estimated spend per hour | sum(rate(gen_ai_client_token_usage_sum{gen_ai_token_type="input"}[1h]) * 3600 * on(gen_ai_request_model) group_left() model_price_input_per_token) + sum(rate(gen_ai_client_token_usage_sum{gen_ai_token_type="output"}[1h]) * 3600 * on(gen_ai_request_model) group_left() model_price_output_per_token) |
| p95 call latency | histogram_quantile(0.95, sum by (le, gen_ai_provider_name) (rate(gen_ai_client_operation_duration_seconds_bucket[5m]))) |
| Guardrail blocks | sum by (provider, action) (increase(agent_guardrail_interventions_total[1h])) |
| Error rate by provider | sum by (gen_ai_provider_name) (rate(gen_ai_client_operation_duration_seconds_count{error_type!=""}[5m])) / sum by (gen_ai_provider_name) (rate(gen_ai_client_operation_duration_seconds_count[5m])) |
For the price join, publish prices as a small recording rule or a static metric you control, for example model_price_output_per_token{gen_ai_request_model="..."} 0.000015. Pricing changes, and a number in a PromQL string goes stale quietly, so keep it in one maintained place. Treat spend as an estimate and reconcile it against the real invoice from each cloud.
For traces, TraceQL answers the questions metrics cannot:
// Agent runs that hit the step cap
{ name = "agent.run" && span.agent.stopped_reason = "max_steps" }

// Slow tool calls inside long runs
{ name = "agent.run" && duration > 15s } >> { span.gen_ai.operation.name = "execute_tool" && duration > 3s }

// Any model call that returned a guardrail intervention
{ span.gen_ai.response.finish_reasons = "guardrail_intervened" }
Alerts
Alert on symptoms people can act on:
groups:
  - name: llm-agents
    rules:
      - alert: LLMSpendSpike
        expr: llm:spend_per_hour:sum > 2 * avg_over_time(llm:spend_per_hour:sum[7d] offset 1h)
        for: 30m
        labels: { severity: page }
      - alert: GuardrailBlockSpike
        expr: sum(increase(agent_guardrail_interventions_total[15m])) > 3 * sum(increase(agent_guardrail_interventions_total[15m] offset 1d)) and sum(increase(agent_guardrail_interventions_total[15m])) > 10
        for: 10m
        labels: { severity: ticket }
        annotations:
          summary: "Guardrail blocks are 3x yesterday. Possible prompt-injection attempt or a bad prompt release."
      - alert: ProviderErrorRateHigh
        expr: llm:error_ratio:rate5m > 0.05
        for: 10m
        labels: { severity: page }
A guardrail spike is ambiguous. It might be an attack, or it might be your latest prompt change making the model produce content that trips a filter. Having both the dashboard and trace links in the alert lets whoever is on call tell the difference in a minute.
Security: what not to record
The dashboard above works without a single prompt or response being stored. That is deliberate.
| Risk | What goes wrong | Control |
|---|---|---|
| Prompts contain PII or secrets | Traces become a copy of sensitive data, readable by everyone with Grafana access | Content capture off by default, strip at collector |
| Tool arguments contain credentials | A tool call span stores a token | Record tool name and status only, not arguments |
| Prompt injection | A document tells the agent to call a tool it should not | Allowlist tools per agent, log denied calls as a metric |
| Cost abuse | One user triggers loops that burn budget | Per-user token budgets, max_steps, spend alert |
| Over-broad Grafana access | Junior or external users see traces | Folder permissions, team-scoped data sources, label-based access |
If you do need content for debugging, capture it for a sampled slice of non-production traffic, set a short retention, and restrict the Tempo data source to a small group. Record the decision and the owner in your runbook.
Wrap-up
Agent observability comes down to three habits. Wrap every model and tool call in a span with the GenAI attributes. Do redaction in the collector, not by trusting each developer. And build panels around the failure modes that are specific to agents: cost, loop depth, tool errors and guardrail interventions. The provider matters much less than you would expect, because once the wrapper normalizes tokens and finish reasons, the same dashboard covers all of them.