Migrating from Grafana Agent to Grafana Alloy on Kubernetes: Scaling Observability Pipelines
Grafana Agent has been the default collector for a lot of Kubernetes clusters, including most I have worked with. In 2024 Grafana Labs introduced Grafana Alloy, an OpenTelemetry Collector distribution with native Prometheus pipelines, and put Agent on a deprecation path with end of life planned for the end of 2025. If you run Agent in static mode, flow mode or the Operator, you have a migration ahead of you. It is better to do it on your schedule than during a security advisory.
This post covers what actually changes, how to convert your configuration, and how to run Alloy so it scales past a few nodes without dropping samples.
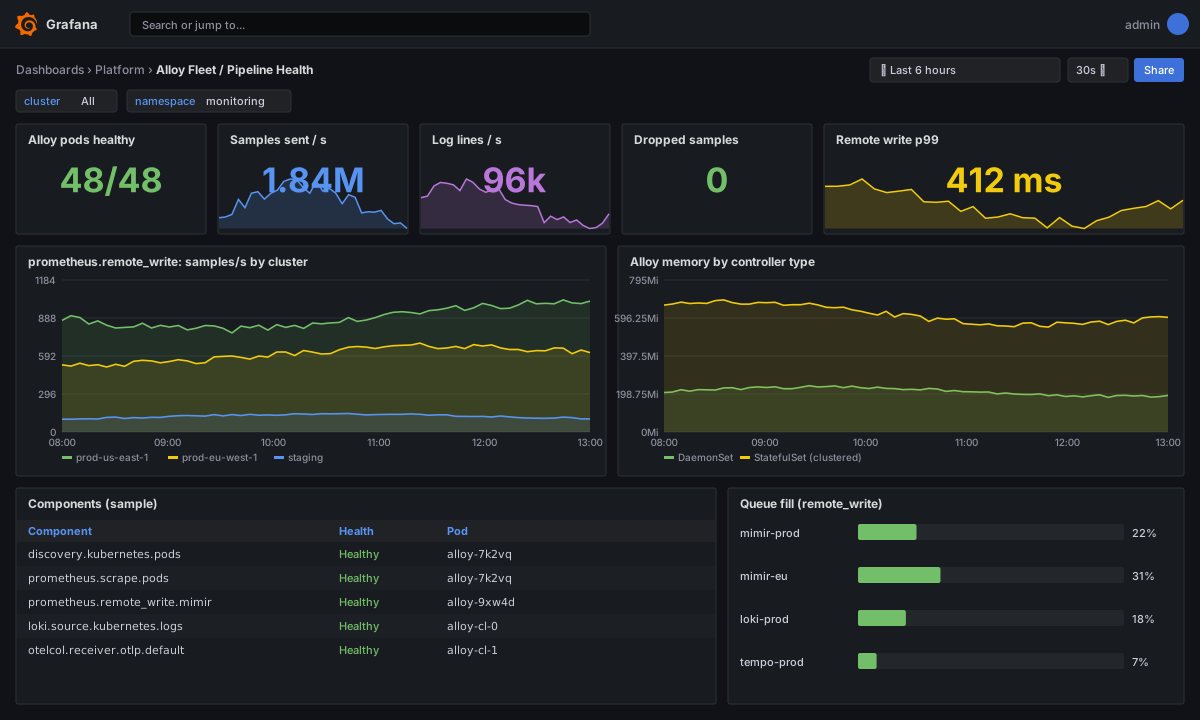
What changes and what does not
Alloy is the successor to Agent flow mode. If you already write River configuration, most of it carries over. The big differences are the name, the syntax moving to the Alloy configuration language (still block-and-attribute style), and first-class support for OpenTelemetry components.
| Topic | Agent static mode | Agent flow mode | Alloy |
|---|---|---|---|
| Config format | YAML | River | Alloy syntax (River evolved) |
| Pipelines | Fixed integrations | Component graph | Component graph |
| OpenTelemetry | Partial | otelcol.* | otelcol.*, full Collector components |
| Clustering | Scraping service | Clustering | Clustering |
| Debug UI | None | :12345 | :12345, live graph and component detail |
| Support horizon | Ending | Ending | Active development |
The mental model is the one worth keeping: components have arguments (inputs), exports (outputs), and you connect one component's export to another's argument. Nothing runs unless something references it.
Target architecture
For clusters of any real size I split Alloy into two roles. A DaemonSet handles per-node work that must run locally: container logs, node-level metrics and kubelet scraping. A small clustered StatefulSet handles scraping of the service discovery targets, so those targets are spread across replicas instead of every node scraping every pod.
Step 1: Convert the existing configuration
Do not rewrite by hand. Alloy ships a converter for static, Prometheus and Promtail configs.
# Convert a Grafana Agent static mode config
alloy convert --source-format=static \
  --bypass-errors \
  --report=convert-report.txt \
  --output=config.alloy \
  agent-static.yaml

# Convert a Promtail config
alloy convert --source-format=promtail --output=logs.alloy promtail.yaml

# Convert a Prometheus config
alloy convert --source-format=prometheus --output=metrics.alloy prometheus.yml
Read convert-report.txt before anything else. It lists every setting that was converted, approximated, or dropped. The things that usually need a manual decision:
- Integrations that were removed or renamed (check each one against the Alloy component reference).
scrape_configswith unusual relabeling. These convert, but I diff the generateddiscovery.relabelblocks by eye.- Anything using the Agent Operator custom resources (
GrafanaAgent,MetricsInstance). Those need the Alloy Helm chart andprometheus.operator.*components instead.
You can also test a converted file without deploying it:
alloy fmt config.alloy          # formatting and syntax check
alloy run config.alloy --server.http.listen-addr=127.0.0.1:12345
Open http://127.0.0.1:12345 and you will see the live component graph. Components in red have errors, and clicking one shows its arguments and exports.
Step 2: Write the pipeline you actually want
A converted config is a starting point. Here is the metrics side of the clustered StatefulSet, trimmed to the essentials. It discovers pods, keeps only the ones that opt in, and ships to remote write.
// metrics.alloy (clustered StatefulSet)
discovery.kubernetes "pods" {
  role = "pod"
}

discovery.relabel "scrape_opt_in" {
  targets = discovery.kubernetes.pods.targets

  rule {
    source_labels = ["__meta_kubernetes_pod_annotation_prometheus_io_scrape"]
    action        = "keep"
    regex         = "true"
  }
  rule {
    source_labels = ["__meta_kubernetes_pod_annotation_prometheus_io_port",
                     "__meta_kubernetes_pod_ip"]
    action        = "replace"
    regex         = "(\\d+);(.+)"
    replacement   = "$2:$1"
    target_label  = "__address__"
  }
  rule {
    source_labels = ["__meta_kubernetes_namespace"]
    target_label  = "namespace"
  }
  rule {
    source_labels = ["__meta_kubernetes_pod_name"]
    target_label  = "pod"
  }
}

prometheus.scrape "pods" {
  targets    = discovery.relabel.scrape_opt_in.output
  forward_to = [prometheus.relabel.drop_noise.receiver]

  clustering {
    enabled = true
  }
}

prometheus.relabel "drop_noise" {
  forward_to = [prometheus.remote_write.mimir.receiver]

  rule {
    source_labels = ["__name__"]
    regex         = "go_gc_.*|go_memstats_.*_bytes_total"
    action        = "drop"
  }
}

prometheus.remote_write "mimir" {
  endpoint {
    url = "https://mimir.example.com/api/v1/push"

    basic_auth {
      username = "tenant-1"
      password = sys.env("MIMIR_TOKEN")
    }

    queue_config {
      capacity             = 10000
      max_shards           = 50
      max_samples_per_send = 2000
    }
  }
}
The clustering { enabled = true } block is the part that matters for scale. With it on, the replicas share the target list and each takes a consistent slice. Add or remove a replica and the targets rebalance without restarting the others.
The DaemonSet side handles logs, since log files live on the node:
// logs.alloy (DaemonSet)
discovery.kubernetes "pods" {
  role = "pod"
  selectors {
    role  = "pod"
    field = "spec.nodeName=" + sys.env("HOSTNAME")
  }
}

loki.source.kubernetes "pods" {
  targets    = discovery.kubernetes.pods.targets
  forward_to = [loki.process.cleanup.receiver]
}

loki.process "cleanup" {
  forward_to = [loki.write.default.receiver]

  stage.drop {
    expression = ".*GET /healthz.*"
  }
}

loki.write "default" {
  endpoint {
    url = "https://loki.example.com/loki/api/v1/push"
  }
}
Two details I check every time. The selectors block limits discovery to the local node, so each DaemonSet pod only watches its own pods. And loki.source.kubernetes tails through the Kubernetes API rather than reading files from disk, which means no hostPath mounts and a tighter security posture.
Step 3: Deploy with the Helm chart
# values-clustered.yaml
controller:
  type: statefulset
  replicas: 3
alloy:
  clustering:
    enabled: true
  configMap:
    create: false
    name: alloy-metrics
    key: config.alloy
  resources:
    requests: { cpu: 500m, memory: 1Gi }
    limits:   { memory: 2Gi }
  extraEnv:
    - name: MIMIR_TOKEN
      valueFrom:
secretKeyRef: { name: mimir-credentials, key: token }helm repo add grafana https://grafana.github.io/helm-charts
helm upgrade --install alloy-metrics grafana/alloy \
-n monitoring --create-namespace \
-f values-clustered.yamlInstall the DaemonSet release the same way with controller.type: daemonset and its own config map.
Step 4: Cut over without a gap
The safe order is to run both collectors in parallel for a day, compare, then retire Agent. Duplicate series are the risk, so add an external label to each release:
prometheus.remote_write "mimir" {
  external_labels = { collector = "alloy" }
  // ...
}
Then check coverage by comparing target counts per job from both collectors:
count by (collector, job) (up{cluster="prod-us-east-1"})If the numbers match for a full day including a deploy and a node scale event, delete the Agent release and drop the collector label in a follow-up change.
| Check | Query or action | Passing result |
|---|---|---|
| Same targets | count by (collector, job) (up) | Equal per job |
| No sample loss | rate(prometheus_remote_storage_samples_failed_total[5m]) | 0 |
| Queue healthy | prometheus_remote_storage_samples_pending | Well under capacity |
| Logs flowing | sum(rate({cluster="prod"}[5m])) by (collector) | Similar rates |
| Resource use | Container memory vs. old Agent | Within 20 percent |
Scaling notes
Things I have seen go wrong as pipelines grow:
- Remote write queue backs up. Raise
max_shardsbeforecapacity. If the receiving end is slow, more shards do not help and you need to look at Mimir ingesters, not Alloy. - Cardinality explosion. Drop labels at the edge with
prometheus.relabel. Dropping at Alloy is cheaper than paying to store and then ignoring the series. - Uneven clustering. Clustering distributes targets, not load. One pod with 40,000 series counts the same as one with 40. Watch per-replica memory, not just replica count.
- Log volume. Drop health checks and debug lines in
loki.processbefore they hit the network.
Alerting on the pipeline itself
Observability pipelines fail quietly, so alert on them:
groups:
  - name: alloy
    rules:
      - alert: AlloyRemoteWriteFailing
        expr: rate(prometheus_remote_storage_samples_failed_total[5m]) > 0
        for: 10m
        labels: { severity: page }
        annotations:
          summary: "Alloy {{ $labels.pod }} is failing remote write"
      - alert: AlloyComponentUnhealthy
        expr: alloy_component_controller_running_components{health_type!="healthy"} > 0
        for: 15m
        labels: { severity: ticket }
Wrap-up
The migration is mostly mechanical. Convert, review the report, deploy a DaemonSet for node-local work and a clustered StatefulSet for target scraping, run both collectors side by side for a day, and compare target counts. Keep the Alloy health dashboard from the figure above on a team screen, because the pipeline that tells you about outages should never be the one you forgot to monitor.