Kubernetes GPU Scheduling and Dynamic Resource Allocation: Scaling LLM Inference on EKS, GKE and AKS
A GPU in Kubernetes used to be one line: nvidia.com/gpu: 1. That line has carried a lot of production inference, and for simple cases it still works. Running an LLM at scale asks for more. A 70B model needs four or eight GPUs connected by a fast interconnect, on one node. Small models want to share a GPU. Model weights are tens of gigabytes that need to arrive before the pod can serve anything. And the scheduler needs to know the difference between an H100 and an L4.
This post covers how to run LLM inference on Kubernetes today across the three major managed services, and what Dynamic Resource Allocation (DRA) changes. DRA graduated to stable in Kubernetes 1.34, released in August 2025. Managed services pick up new Kubernetes versions on their own schedules, so verify what your cluster version and release channel support before you plan around it.
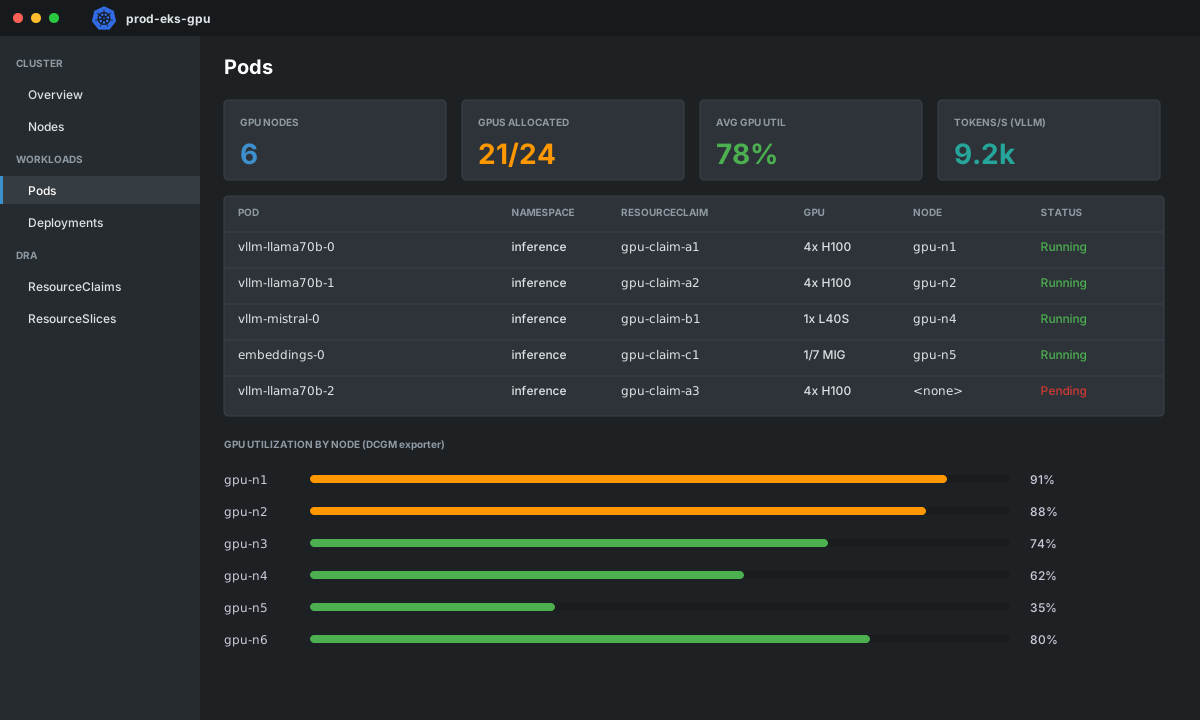
The pieces of a GPU inference stack
| Layer | Job | Common tool |
|---|---|---|
| GPU drivers and runtime | Make GPUs usable in containers | NVIDIA GPU Operator, or the cloud's managed driver install |
| Device exposure | Tell the scheduler what GPUs exist | Device plugin today, DRA going forward |
| Serving | Batch requests, manage KV cache | vLLM, TGI, TensorRT-LLM, Triton |
| Autoscaling | Match replicas to demand | KEDA or HPA on serving metrics |
| Node capacity | Provide GPU nodes when needed | Karpenter, cluster autoscaler, node auto-provisioning |
| Observability | Utilization, memory, errors | DCGM exporter, serving metrics |
Start with the device plugin, because it works
The NVIDIA device plugin advertises nvidia.com/gpu as an integer resource. Pods request whole GPUs. That is all the scheduler knows.
A vLLM deployment for a 70B model on four GPUs looks like this:
apiVersion: apps/v1
kind: Deployment
metadata:
  name: vllm-llama70b
  namespace: inference
spec:
  replicas: 2
  selector:
    matchLabels: { app: vllm-llama70b }
  template:
    metadata:
      labels: { app: vllm-llama70b }
    spec:
      tolerations:
        - key: nvidia.com/gpu
          operator: Exists
          effect: NoSchedule
      nodeSelector:
        node.kubernetes.io/instance-type: p5.48xlarge   # example; see provider table
      containers:
        - name: vllm
          image: vllm/vllm-openai:<pinned-version>
          args:
            - --model=/models/llama-70b-instruct
            - --tensor-parallel-size=4
            - --max-model-len=16384
            - --gpu-memory-utilization=0.90
          ports: [{ containerPort: 8000 }]
          resources:
            limits:
              nvidia.com/gpu: 4
              memory: 400Gi
            requests:
              cpu: "24"
              memory: 400Gi
          volumeMounts:
            - { name: models, mountPath: /models, readOnly: true }
            - { name: shm, mountPath: /dev/shm }
          startupProbe:
            httpGet: { path: /health, port: 8000 }
            failureThreshold: 90
            periodSeconds: 10          # allow up to 15 minutes to load weights
          readinessProbe:
            httpGet: { path: /health, port: 8000 }
            periodSeconds: 10
      volumes:
        - name: models
          persistentVolumeClaim: { claimName: llama-70b-weights }
        - name: shm
          emptyDir: { medium: Memory, sizeLimit: 32Gi }
Details here that are easy to miss:
- Shared memory. Multi-GPU inference uses
/dev/shmfor inter-process communication. The default 64 MiB crashes it. Mount an in-memoryemptyDir. - Startup probe. Loading 140 GB of weights takes minutes. A readiness probe alone will mark the pod unhealthy and restart it in a loop. Use a generous
startupProbe. - Tensor parallel size equals GPU count. Request four GPUs and set
--tensor-parallel-size=4. Mismatches fail at startup or leave GPUs idle. - Taints. Keep non-GPU workloads off expensive nodes. Taint GPU nodes and add the toleration only to inference pods.
Provider differences that matter
The Kubernetes side is identical. The differences are in naming, driver management and capacity.
| EKS | GKE | AKS | |
|---|---|---|---|
| Large GPU instances | P5 (H100), P4d (A100), G6e (L40S) | A3 (H100), A2 (A100), G2 (L4) | ND H100 v5, NC A100 v4, NC-series |
| Select by | node.kubernetes.io/instance-type or Karpenter requirements | cloud.google.com/gke-accelerator: nvidia-h100-80gb | VM size on the node pool, labels |
| Driver install | GPU Operator or EKS accelerated AMI with drivers | GKE installs drivers (gpu-driver-version option) | Pre-installed on GPU VM images, or GPU Operator |
| Node scaling | Karpenter with GPU NodePool | Node auto-provisioning, Autopilot compute classes | Cluster autoscaler or node auto-provisioning (Karpenter-based) |
| Capacity | Capacity Blocks, On-Demand Capacity Reservations | Reservations, Dynamic Workload Scheduler | Capacity reservations |
| Typical gotcha | Quota per instance family and region | Quota and zone availability for accelerators | Quota per VM family, regional availability |
The honest summary: GPU capacity is a procurement problem before it is a Kubernetes problem. Request quota early, use reservations for steady baseline load, and use on-demand or spot only for burst. A perfect autoscaling policy cannot create GPUs the region does not have.
A Karpenter pool for GPU nodes on EKS:
apiVersion: karpenter.sh/v1
kind: NodePool
metadata: { name: gpu-inference }
spec:
  template:
    spec:
      nodeClassRef: { group: karpenter.k8s.aws, kind: EC2NodeClass, name: gpu }
      taints:
        - { key: nvidia.com/gpu, value: "true", effect: NoSchedule }
      requirements:
        - key: karpenter.k8s.aws/instance-family
          operator: In
          values: ["p5", "g6e"]
        - key: karpenter.sh/capacity-type
          operator: In
          values: ["on-demand"]          # reserved or on-demand for inference baseline
  limits:
    nvidia.com/gpu: "32"
  disruption:
    consolidationPolicy: WhenEmpty
    consolidateAfter: 30m
Consolidation on GPU nodes is deliberately conservative. Replacing an underused node means reloading weights, which can take longer than the saving justifies.
Where the device plugin runs out
| Limitation | Example |
|---|---|
| Whole GPUs only | A 3B embedding model uses 10 percent of an A100 and blocks the rest |
| No device attributes | The scheduler cannot ask for "an H100 with at least 80 GB" except through node labels |
| No topology awareness | Four GPUs on one node, but are they NVLink-connected? You cannot express it |
| Sharing needs workarounds | Time-slicing and MIG are configured through node labels and plugin config, outside the pod spec |
| No per-pod device config | Changing MIG profile or sharing mode means node-level changes |
Teams work around these with node labels, separate node pools per GPU type, and plugin configuration for MIG and time-slicing. It works, but the configuration lives far away from the workload that depends on it.
What DRA changes
Dynamic Resource Allocation moves devices from an integer counter to a structured, claimable resource, similar to how PersistentVolumeClaims work for storage.
| Object | Role |
|---|---|
ResourceSlice | Published by the driver. Lists the devices on a node with attributes (product name, memory, MIG profile) |
DeviceClass | A category of device with selection rules, defined by the cluster admin or the driver |
ResourceClaim | A request for devices, with selectors, shared or exclusive |
ResourceClaimTemplate | Generates a claim per pod, so each replica gets its own devices |
A claim for four H100 GPUs with a selector on the device attribute:
apiVersion: resource.k8s.io/v1
kind: ResourceClaimTemplate
metadata:
  name: h100-x4
  namespace: inference
spec:
  spec:
    devices:
      requests:
        - name: gpus
          exactly:
            deviceClassName: gpu.nvidia.com
            count: 4
            selectors:
              - cel:
                  expression: device.attributes["gpu.nvidia.com"].productName.matches("H100")
---
apiVersion: apps/v1
kind: Deployment
metadata: { name: vllm-llama70b, namespace: inference }
spec:
  replicas: 2
  selector: { matchLabels: { app: vllm-llama70b } }
  template:
    metadata: { labels: { app: vllm-llama70b } }
    spec:
      resourceClaims:
        - name: gpus
          resourceClaimTemplateName: h100-x4
      containers:
        - name: vllm
          image: vllm/vllm-openai:<pinned-version>
          resources:
            claims:
              - name: gpus
The attribute names depend on the driver you install, so run kubectl get resourceslices -o yaml to see what yours publishes, and use kubectl explain resourceclaimtemplate.spec.spec.devices.requests to confirm the schema for your cluster version. The API changed shape during beta, so older examples you find online may not apply.
What this buys you in practice:
| Benefit | Why it matters for LLM workloads |
|---|---|
| Request by attribute, not by node label | "H100, 80 GB" expressed in the pod, not in a separate node pool convention |
| Sharing and partitioning in the claim | A small model can claim a MIG slice without node-level reconfiguration |
| Claims have a lifecycle | Devices are allocated, bound and released with visibility via kubectl get resourceclaims |
| Better fit for multi-GPU topology | Drivers can expose interconnect information to the scheduler as the ecosystem matures |
| Works for more than GPUs | NICs, FPGAs and other accelerators use the same model |
Be realistic about timing. The core API is stable, but the experience depends on your cloud's Kubernetes version, the vendor's DRA driver, and your serving stack. Most production inference today still runs on the device plugin. A reasonable plan is to try DRA on a non-production cluster, learn the claim model, and migrate workloads once your provider and driver are ready.
Autoscaling inference replicas
CPU is a poor signal for LLM serving. The useful signals come from the serving layer. vLLM exposes Prometheus metrics, including queue length and running requests, and the exact metric names vary by version, so check /metrics on yours.
apiVersion: keda.sh/v1alpha1
kind: ScaledObject
metadata: { name: vllm-llama70b, namespace: inference }
spec:
  scaleTargetRef: { name: vllm-llama70b }
  minReplicaCount: 2
  maxReplicaCount: 8
  cooldownPeriod: 600
  advanced:
    horizontalPodAutoscalerConfig:
      behavior:
        scaleDown:
          stabilizationWindowSeconds: 900
  triggers:
    - type: prometheus
      metadata:
        serverAddress: http://prometheus.monitoring.svc:9090
        query: avg(vllm:num_requests_waiting{app="vllm-llama70b"})
        threshold: "4"
Scaling GPU inference is slow. A new replica needs a node (minutes if one is not available), weights loaded (minutes more), and warmup. Plan for it:
| Technique | Effect |
|---|---|
Keep a warm baseline (minReplicaCount) | Absorbs normal peaks without scaling |
| Scale on queue depth, not utilization | Reacts before latency suffers |
| Long scale-down stabilization | Avoids paying the load time again after a short lull |
| Pre-pull weights to node-local storage or a fast shared volume | Cuts startup from many minutes to seconds |
| Rate-limit and shed load at the gateway | Protects latency while new capacity arrives |
| Separate pools per model size | A 3B model should not occupy an 8-GPU node |
Observing GPUs
Install the DCGM exporter (the GPU Operator can do it) and watch four things:
# GPU utilization per node
avg by (Hostname) (DCGM_FI_DEV_GPU_UTIL)

# GPU memory used (watch for OOM risk when you raise max-model-len)
avg by (Hostname) (DCGM_FI_DEV_FB_USED / (DCGM_FI_DEV_FB_USED + DCGM_FI_DEV_FB_FREE))

# Requests waiting in the serving queue
sum(vllm:num_requests_waiting)

# GPUs allocated vs available
sum(kube_pod_container_resource_limits{resource="nvidia_com_gpu"})
Low GPU utilization with a growing queue usually means a configuration problem, such as small batch limits, CPU-bound tokenization, or a slow network path to the gateway. High utilization with a growing queue means you need more GPUs.
Wrap-up
For production today, run vLLM or a similar server on the device plugin with taints, generous startup probes, in-memory shared memory, and autoscaling on queue depth. Treat GPU capacity as a quota and reservation problem first. Then learn DRA on the side: it makes device selection and sharing part of the workload definition, which is where it belongs, and the sooner your team understands claims, the easier the migration will be when your cloud and driver support are ready.